A crown fire run!
Once I got an ELMFIRE build up and running, and I could get a fire to actually propagate on my Arizona LANDFIRE landscape, I started working through successive small changes in the model inputs. When running ELMFIRE, you accomplish this by changing the elmfire.data.in namelists (see HERE for an example from a tutorial). I picked a point on the map for an ignition, and started with constant weather conditions (wind from 275o at 15mph, and constant fuel moisture).
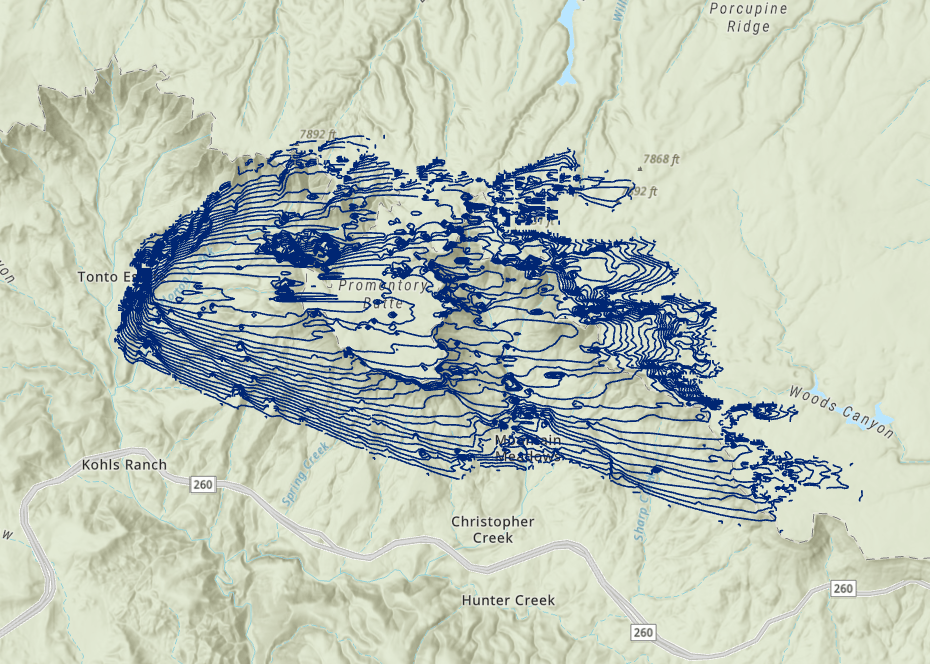
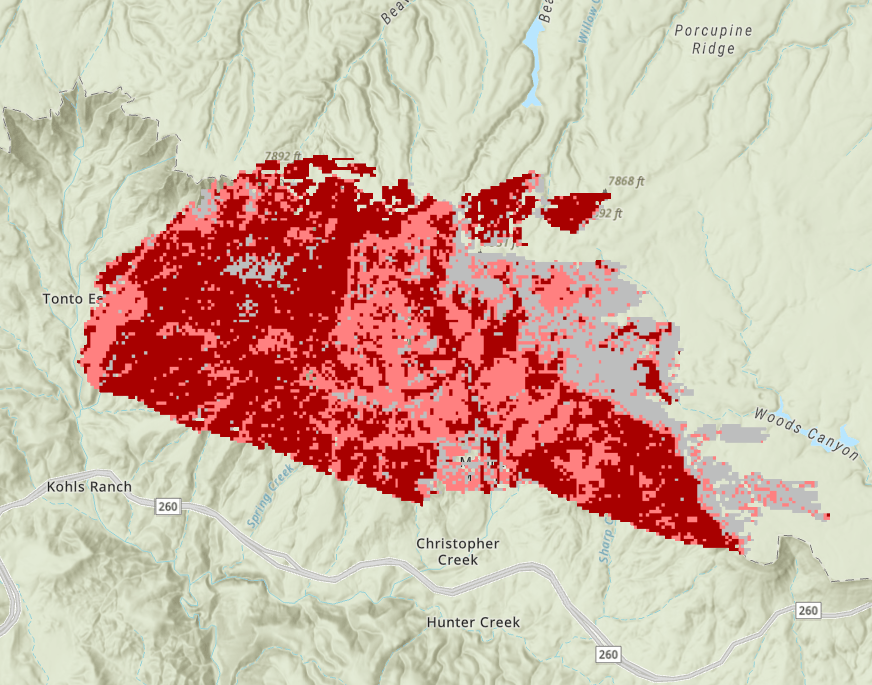
These screenshots from ArcGIS Pro show one model run with an ignition on the left side of the image. The image on the left is the hourly isochrones for one model run, and the image on the right is the corresponding crown fire raster where dark red = active crown fire, light red = passive crown fire, and gray = surface fire only.
The default canopy cover for crown fire calculations in ELMFIRE v2025.1002 was 39%, so every cell that has a canopy cover less than 40% cannot support active crown fire in the model, and has to burn with passive crown fire.1
Passive crown fire is a situation where the canopy of a tree or group of trees torches but flaming is maintained only for a short amount of time. Active crown fire occurs when combustion of the canopy and surface fuels are coupled, maintaining continuous propagation in the canopy.
Mathematically, the surface fire has to exceed the Van Wagner critical fireline intensity for crown fire initiation. Then ELMFIRE calculates the potential active crown fire spread rate using the Cruz et al. (2004) model.2
Two ignitions
I tried adding a second ignition into the model. I added one slightly to the north of the initial ignition, and set the ignition time to 1 minute into the run (ELMFIRE would not let me set the two ignitions at exactly the same time). I used the same constant weather conditions as above (Wind direction 275o, 15mph).
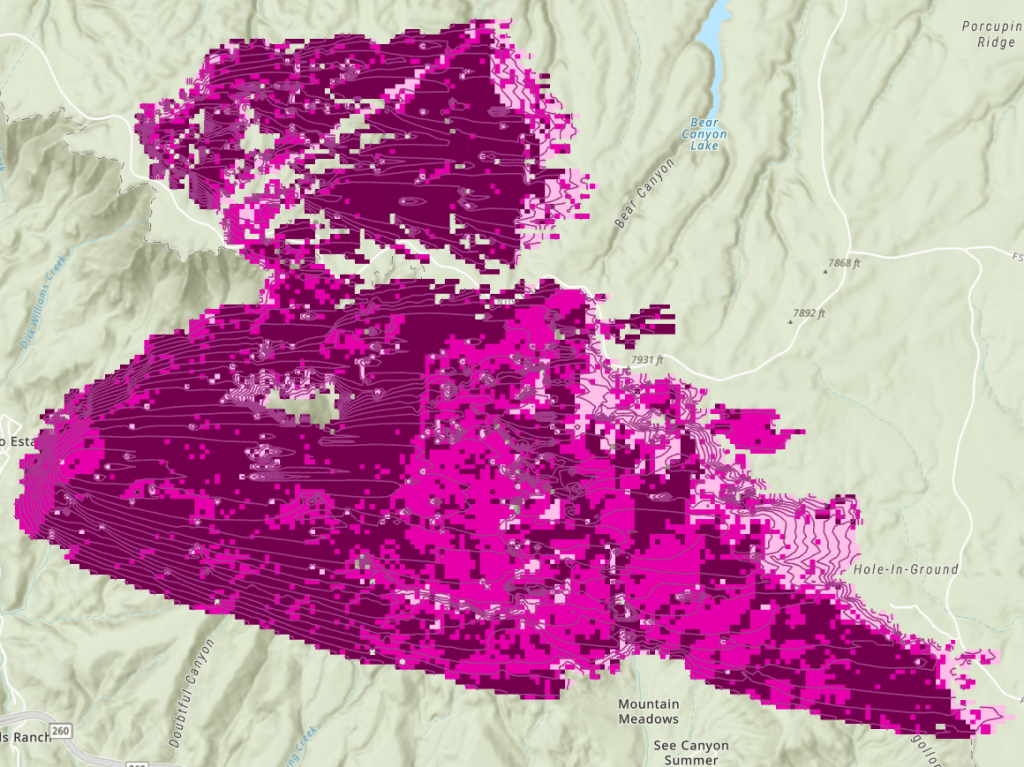
And lastly, I changed wind direction using the same two ignitions. For this scenario I used constant fuel moisture, with a wind from 210o at 15mph for 16 hours.
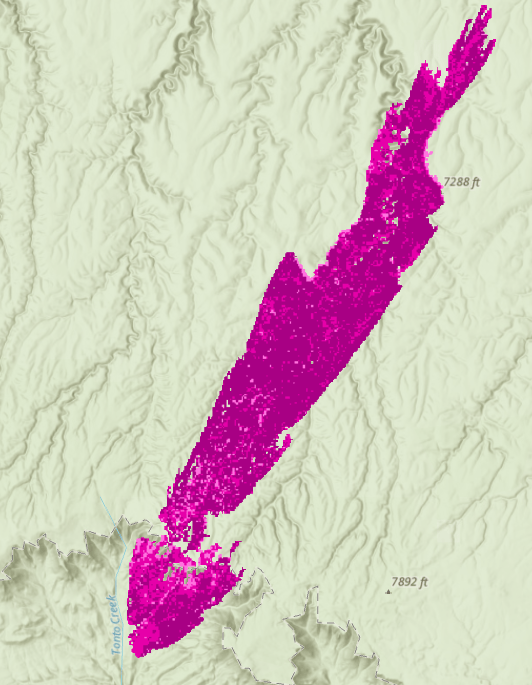
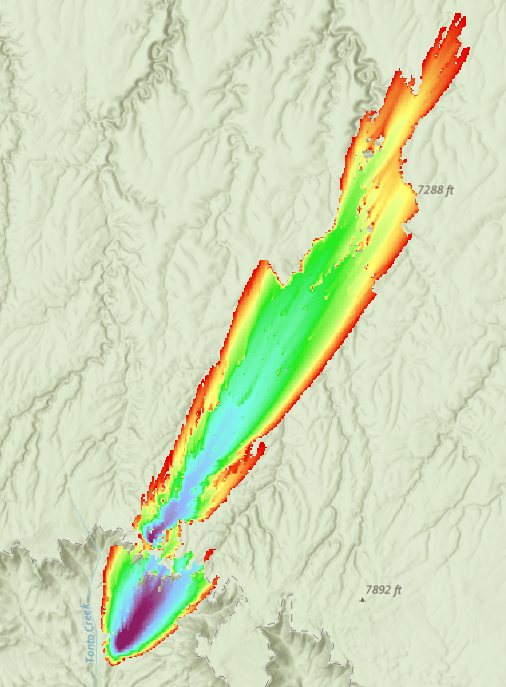
Here the crown fire raster is on the left (again darkest is active crown fire), and the rainbow image on the right is the arrival-time raster. Sorry I don’t have legends on these screenshots. The dark purple is early arrival time and latest arrival times are bright red. You can see the two ignitions, and you can see how much farther the northern fire reaches in the 16-hour model time. We can relate that to fuel model and canopy variables next time.


Leave a comment