Background
I started this project as a follow-up to a class project (in my GIS for Urban Planning class, spring 2026 @ ASU) where I produced a risk map for transmission lines near Paradise, California, looking back at the conditions in 2018 prior to the Camp Fire. I used this AZ project to learn about fire modeling, learn how to use ELMFIRE, and learn more Python programming.
The Arizona study area
I wanted to design a project that built on my Paradise 2018 class work, that would include model outputs that I generated. I elected to stick with transmission lines as a subject and chose a site in east-central Arizona that I am familiar with (living in the Phoenix area and having visited the Mogollon Rim often). I chose a small area to minimize compute-time, and I was limited by the requirement of having high-voltage transmission lines cross the study area. I talked about getting the LANDFIRE landscape in a previous post.
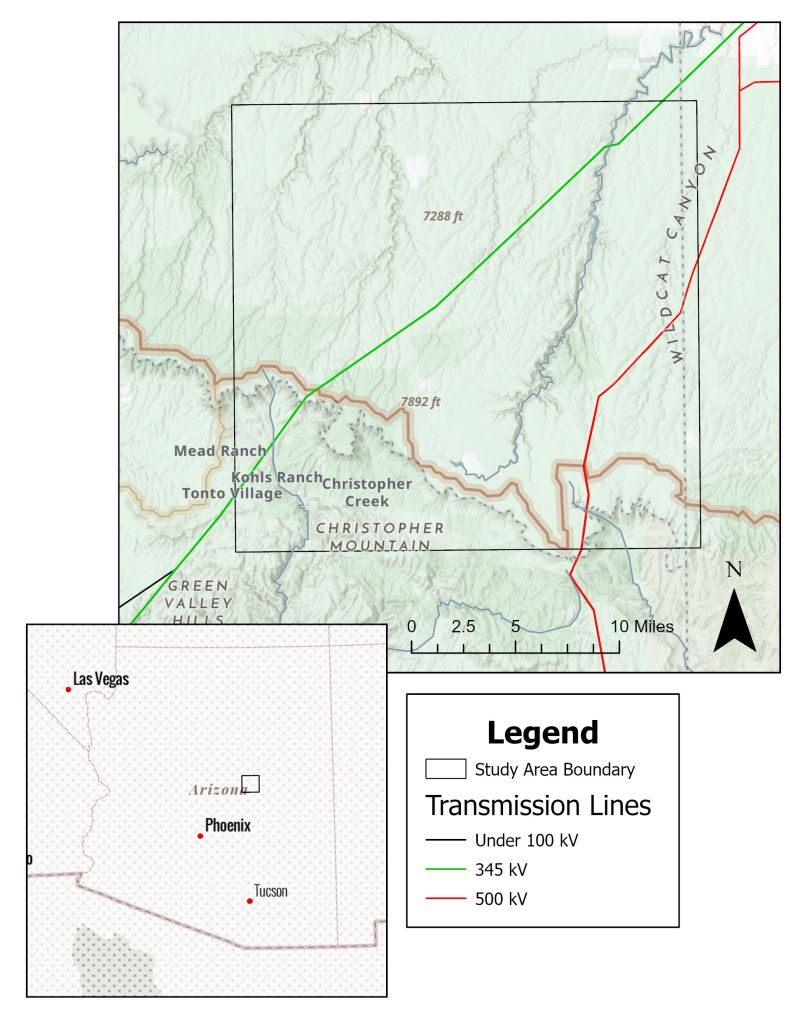
The main question of this project is: what section(s) of transmission lines are most exposed to wildfire, and therefore potentially most vulnerable to damage from wildfire in the area? In order to answer this question, I had to choose a representative time of year for weather scenarios to use in modeling. The most dangerous time of year in the area is pre-monsoon summer, the months of May and June in particular. To determine fuel and weather conditions, I found a Pocket Card for the Mogollon West area from the National Wildfire Coordinating Group. Pocket Cards summarize fire potential based on historical weather and fire occurrence for a localized area. Using the card, I came up with a general fuel moisture scenario for pre-monsoon severe fire weather.
| Fuel Class | Moisture (%) |
| 1-hour | 5 |
| 10-hour | 6 |
| 100-hour | 8 |
| Live Herbaceous | 45 |
| Live Woody | 90 |
To determine wind speed and direction for the models, I used ASOS Network wind data for the months of May and June from 2020-2026. The majority of recorded wind directions for May-June in the area (Payson and Winslow) range from South to West, and I chose the representative direction of Southwest at 225o. A severe fire-weather scenario from the Pocket Card indicates wind speed in excess of 15mph.
Working with ELMFIRE
I have already talked about learning how to use ELMFIRE a bit in other posts here, here, and here.
I wanted to generate a conditional burn probability for the entire study area, which meant using the Monte Carlo simulation mode in ELMFIRE. I ramped up from 100 ignitions, using the weather and fuel moisture inputs noted above. In order to determine if the Monte Carlo model was converging, I calculated the Burn Probability and Coefficient of Variation for each raster cell. Burn probability is represented by , where k is the number of times burned, and N is the number of Monte Carlo members. Then the coefficient of variation can be represented by the binomial distribution:
I defined convergence as >99% of cells with a 1%, having a CV 20%. Model runs with over 10,000 ignitions were considered converged in this case. A ‘times-burned’ output raster was created for the AZ study area with a 50,000-member Monte Carlo run.
ELMFIRE Mode 2 calculates fire potential outputs for each input raster cell as if that cell were burning at the head of a fire under the input weather and moisture conditions. The major outputs of Mode 2 are flame length and spread rate at each cell. For the AZ study area, I conducted a Mode 2 run with the same weather and fuel moisture inputs as the Monte Carlo run. I used flame length as a proxy for burn severity across the study area.
Exposure Results
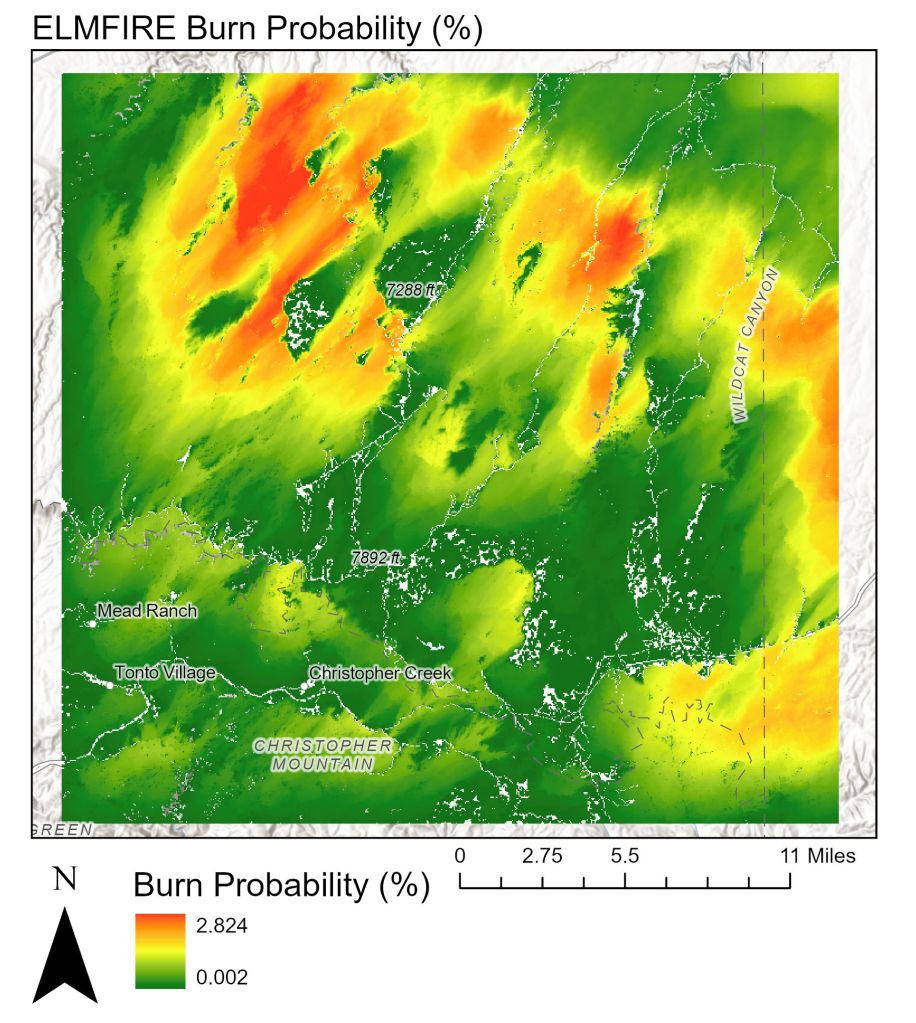
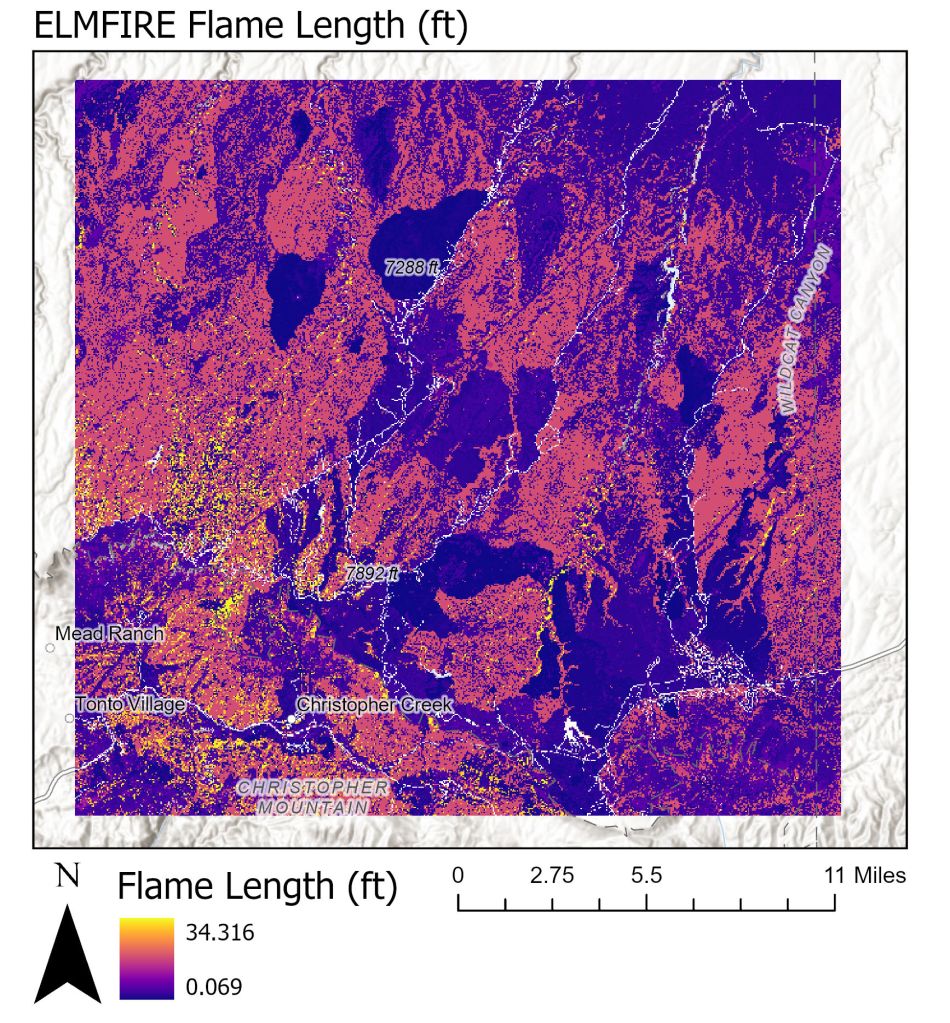
In order to form a reasonable exposure classification for the transmission lines in the study area, I first classified mean burn probability and mean flame length into four categories:
| BP ↓ / FL → | 1: ≤4 ft | 2: 4–8 ft | 3: 8–12 ft | 4: >12 ft |
| 1: <0.25% | Low | Low | Moderate | High |
| 2: 0.25-0.60% | Low | Moderate | High | High |
| 3: 0.60-1.25% | Moderate | High | High | Very High |
| 4: ≥1.25% | High | High | Very High | Very High |
For the exposure metric, I segmented the transmission lines within the study area into 1 km-length segments and buffered the lines at 500 meters. I combined the burn probability and flame length classifications into one fire potential metric.
| BP ↓ / FL → | 1: ≤4 ft | 2: 4–8 ft | 3: 8–12 ft | 4: >12 ft | Total Segments |
| 1: <0.25% | 15 (low) | 9 (low) | 15 (mod) | 6 (high) | 45 |
| 2: 0.25–0.60% | 13 (low) | 15 (mod) | 18 (high) | 2 (high) | 48 |
| 3: 0.60–1.25% | 2 (mod) | 12 (high) | 11 (high) | 0 (very high) | 25 |
| 4: ≥1.25% | 0 (high) | 19 (high) | 8 (very high) | 0 (very high) | 27 |
| Total | 30 | 55 | 52 | 8 | 145 |
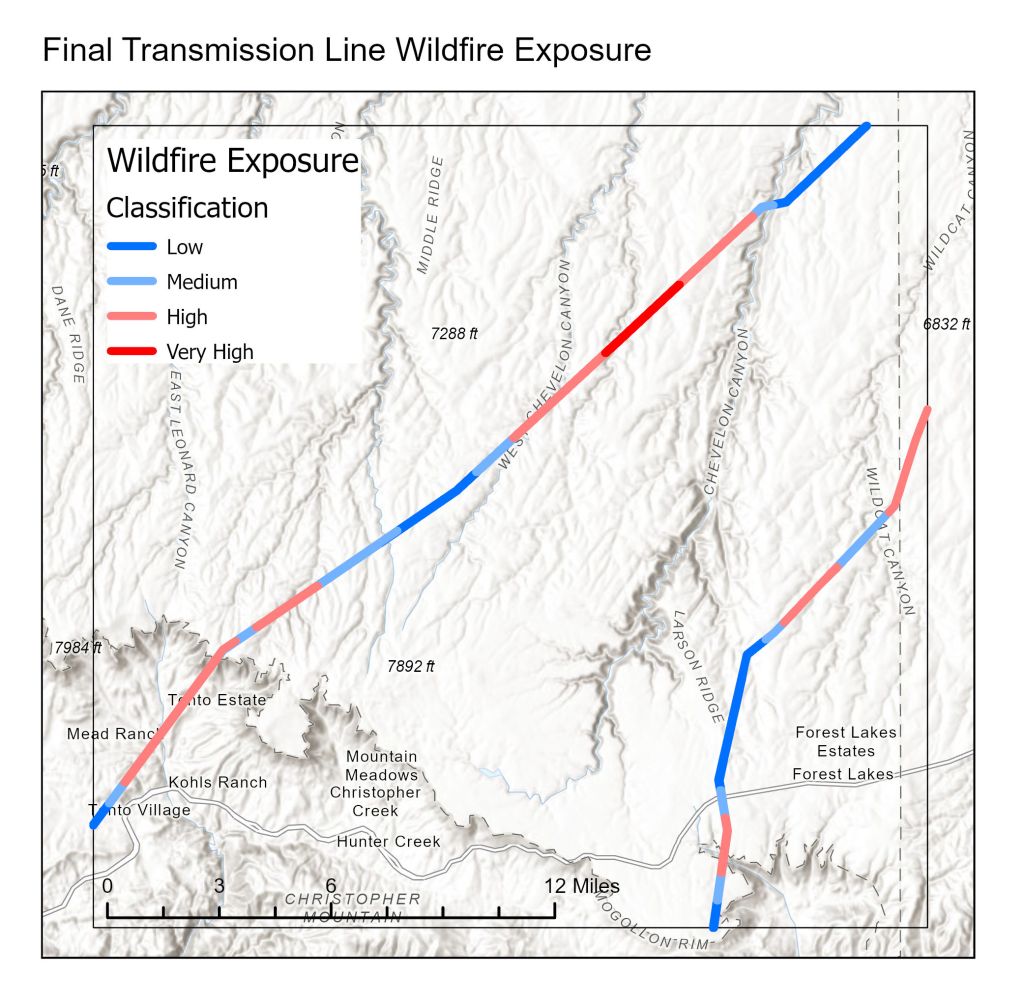
The major conclusion is that there is an approximately 8km corridor between Chevelon Canyon and West Chevelon Canyon within the study area that has the highest exposure to wildfire under the representative pre-monsoon conditions. Given a budget and realistic goals of the power company, the ‘Very High’ exposure transmission lines could be targeted for mitigation.
The study was limited to one representative moisture and weather condition, as well as no infrastructure information such as vulnerability to fire (recent mitigation, etc.).


Leave a comment