Looking at the burn probability map made from the Monte Carlo simulation (here and here), there are a couple of interesting areas that stand out, marked with blue arrows below.
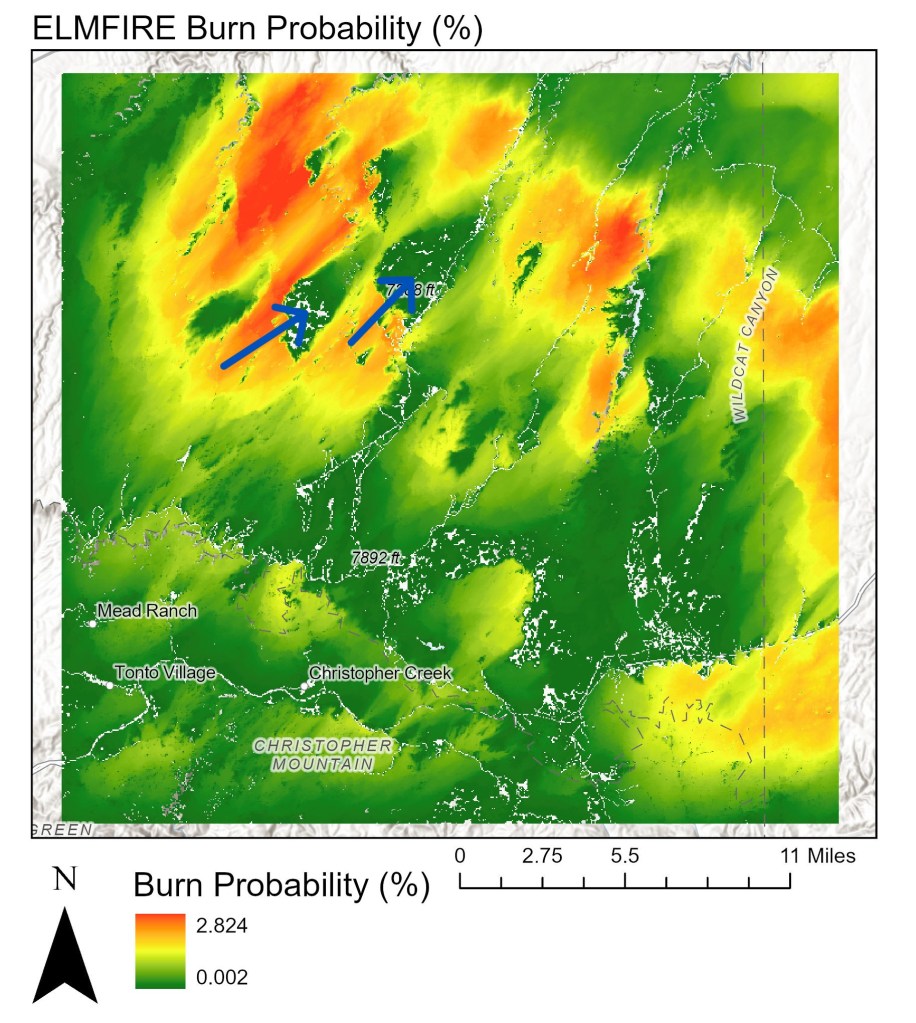
Why are these low burn probability areas essentially in the middle of a higher burn probability zone? Note that for this simulation, wind is coming from the southwest, so it is nearly in the direction I drew the blue arrows. Fire could be moving from the higher (red) burn probability areas along with the wind direction. Something is stopping it!
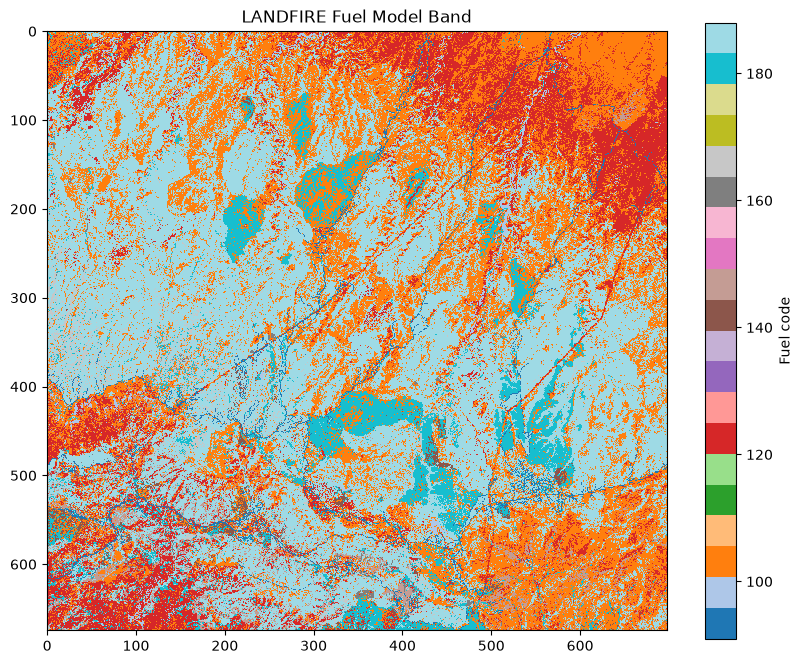
Here is a representation of the fuel model band from the LANDFIRE raster. Do you notice those darker blue regions that have a similar shape to the lower burn probability zones? One of them is centered around row 225 column 225. Could these fuels have something to do with the burn probability results?
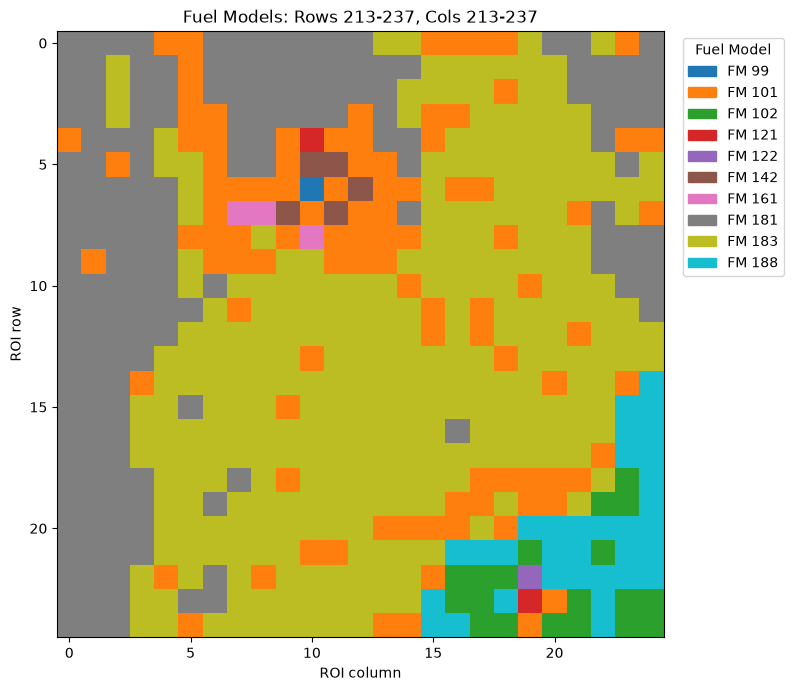
Let’s zoom in on that area. The dominant fuel models are 183 (moderate load conifer litter) and 181 (low load compact conifer litter). Fuel model 188 (long-needle litter) is dominant in the surrounding higher burn probability areas.
How can we look at fire behavior just in these fuel types? There is an open-source set of Python libraries for this, called Pyretechnics!
With Pyretechnics you can calculate fire behavior independent of running a full fire model. The outputs of this set of calculations include fireline intensity, flame length, and spread rate. Inputs are the fuel model, plus the fuel moisture and weather conditions you are interested in. In this case, I used the same conditions as I did for the ELMFIRE models.
| Fuel Model | Fireline Intensity (kW/m) | Flame length (m) | Spread rate (m/min) |
| 181 | 7.04 | 0.19 | 0.34 |
| 183 | 45.55 | 0.49 | 1.18 |
| 188 | 1367.85 | 2.15 | 9.75 |
The fireline intensity output of fuel model 188 is over 150 times that of fuel model 181! Flame length is calculated at over 2 meters for fuel model 188, while flame length for fuel model 181 is only 20 cm. All of these outputs indicate that fuel model 188 will burn much more intensely under these input conditions than fuel model 181, with fuel model 183 between the two but closer to 181’s behavior.
(These calculations are made for surface fire in any direction, found here in the Pyretechnics Library documentation)
The ELMFIRE model included crown fire, so the crown variables are important. For fuel model 181 in the area picturead above:
| Canopy cover | Canopy height (m) | Canopy base height (m) | Canopy bulk density (kg/m3) | |
| Count (cells) | 170 | 170 | 170 | 170 |
| Mean | 17.5 | 11.3 | 4.88 | 0.029 |
| Std Dev | 11.5 | 7.47 | 3.43 | 0.019 |
| Min | 0 | 0 | 0 | 0 |
| 25% | 0 | 0 | 0 | 0 |
| 50% | 25 | 15 | 6.5 | 0.04 |
| 75% | 25 | 15 | 6.5 | 0.04 |
| Max | 35 | 19 | 8.9 | 0.06 |
The canopy cover for this fuel model in this area never exceeds 35%, which means this fuel model in this area cannot support crown fire in the fire model.
Comparatively for fuel model 183:
| Canopy cover | Canopy height (m) | Canopy base height (m) | Canopy bulk density (kg/m3) | |
| Count (cells) | 291 | 291 | 291 | 291 |
| Mean | 44.96 | 15.7 | 0.49 | 0.08 |
| Std Dev | 0.58 | 2.04 | 0.36 | 0.008 |
| Min | 35 | 7 | 0.3 | 0.06 |
| 25% | 45 | 15 | 0.3 | 0.08 |
| 50% | 45 | 15 | 0.3 | 0.08 |
| 75% | 45 | 15 | 0.3 | 0.08 |
| Max | 45 | 19 | 2.7 | 0.12 |
Canopy cover indicates this fuel model will support crown fire in the fire model. However, canopy bulk densities are low.
I haven’t combined the surface and crown fire yet, that seems like the next thing to look at! But in general here, fuel models 181 and 183 burn with so much lower intensity that it makes sense a fire burning in that direction would significantly slow once reaching that fuel.


Leave a Reply